Downtime is the most fearful word in todays tech dependent businesses, which can cost thousands of dollars in lost revenue, reputation, and lost clients.
Downtime can be either planned or unplanned. When your IT team needs to make important technology updates, they may have to turn off your network temporarily. When planned ahead, your IT team can schedule the outage to limit the effects on your organization.
The consequences
When we talk about the consequences and cost of network downtime, we are discussing unplanned or unexpected network outages. Unplanned network downtime cannot only be a financial drain for your business, but it can also lead to more serious issues for your IT, such as a cyberattack.
Most businesses spend a lot of time calculating the cost and return on investment of a networking solution; however, many overlook the equally important factor that is, the cost of network downtime.
The cost of network downtime only climbs higher as our systems become more interconnected. A network outage can slow down or stop operations at every level, from the point of sale to the top level and everything in between. Your company can lose time, productivity, customers, and profits.
“Data from Statista suggests that the average cost of critical server outages in 2019 ranged from $301,000 and $400,000 per hour”. Of course, this number depends on the business size and the type of industry, but it is a high amount none the less.
Some of the direct costs from network outages that are sometimes forgotten are:
- Lost employee productivity
- Possible regulatory fines
- Costs associated with any resulting IT investigation
There’s also a direct revenue impact from the potentially massive hit to the organisation’s reputation, including customer attrition and share price. In some extreme cases, data and monetary losses from unplanned outages can even cause a company to go out of business!
Major causes of unplanned downtime
Major causes of network downtime include human error, equipment failure, poor cybersecurity, and the lack of proper network performance monitoring measures in place.
Looking for a network performance monitor? Try our complete monitoring suite. Download a free trial now.
Can downtime be prevented?
The best defense against a network outage, of course, is to prevent an outage from happening in the first place. Tools such as a network performance monitoring (or NPM) platform continuously observe the devices and transactions on a network to look for performance-affecting issues. They allow network administrators to keep a constant eye on their network and fix performance problems before they happen.
Blësk’s comprehensive NPM
blësk Network Performance Monitor (NPM) improves the performance and health of your network. It is used to trace serial data such as CPU load or the use of bandwidth. It collects, analyzes, and measures performance data for SNMP compliant devices in near real time. The NPM solution comes as a part of the blësk complete network monitoring solution, so you have complete visibility across the network.
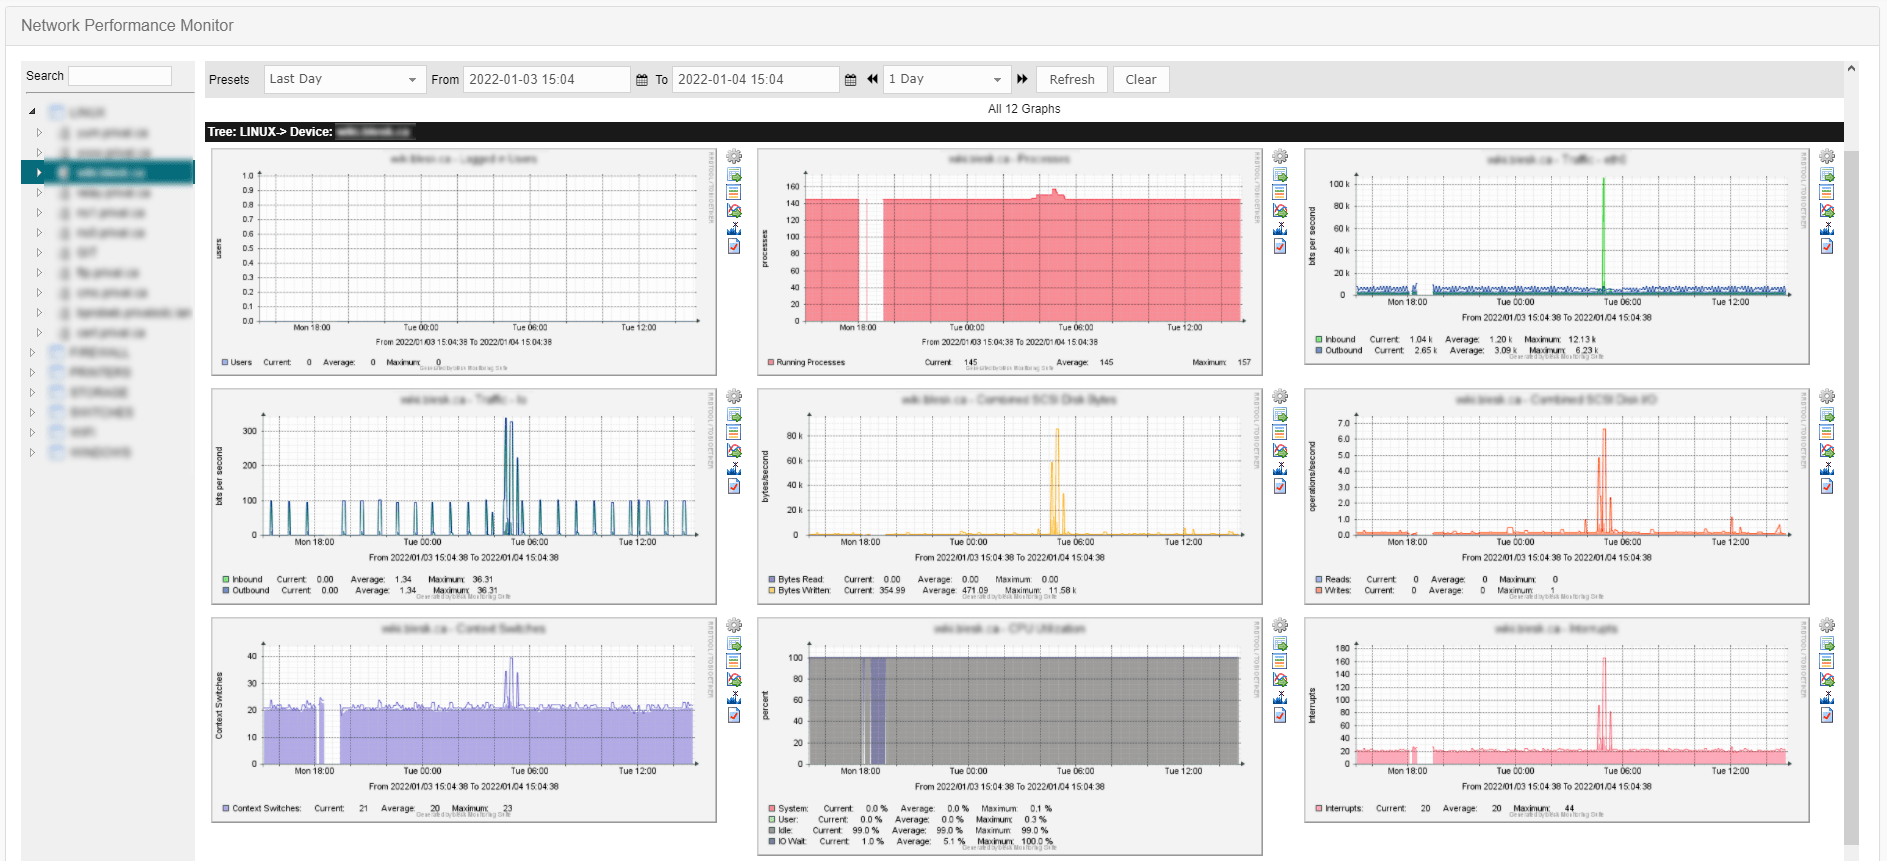
blësk NPM detects, diagnoses, and helps resolve performance problems before breakdowns occur. Using Cacti, it collects and analyzes data from routers, switches, servers, and other SNMP compatible devices in almost real time, presenting the data in graphs for detailed monitoring.

The Key features of NPM includes:
- Automatic Device Detection
- Saturation Forecast
- Ranking of Interface Ports
- 1 Second Interval Accuracy
- Graphic Representation
blësk NPM creates a service-oriented view of your IT infrastructure and identify the main network problems. It automatically detects, maps, and monitors all devices on a network and presents graphs and interactive linear tables. Thanks to innovative technologies integrated in NPM, your IT team can query services at predetermined intervals and can graph the resulting data.
It follows an automated 3 step cycles as the following:
- Collection of data
- Calculation of algorithms
- Displays results in different views
In summary, blësk NPM offers you:
- A performance analysis dashboard;
- A view of the loss and latency of different devices;
- Unlimited graphic elements;
- Manipulation of graphical data;
- A health status of the network.
We understand that some organizations may not have inhouse capacity to facilitate many essential tasks; therefore, blësk offers managed services for the low resourced companies to monitor their network services.
Download a free trial of blësk or contact us for more information.


