All businesses are different; however, the value of their computer network to their business are same. As a business grows, its network grows not only in size and complexity but also in significance and value. The network not only supports the company, but it is also the key element of a business.
At its most basic and strategic level, the network is about collaboration, communication, commerce and everything that keeps a business running and growing. It’s where business applications are hosted, and where mission-critical customer, product, and business information are stored.
Ensuring the availability of a computer network is essential, which is sometimes challenging because of threats such as hackers, denial of service attacks, viruses, and information theft. All of which can lead to downtime, loss of data, and overall decreasing credibility and profitability.
Networks have evolved from a handful of elements to more complex designs with advanced technologies and devices. Network monitoring tools allow admins to know about the overall network’s health, performance, and potential issues. To ease network monitoring and management, having real-time network statistics is crucial. The role of network monitoring solution is to provide the essential stats and crucial information regarding various network components. They’re designed to facilitate the tracking of data and traffic flowing to and from the network links (host and client).
The data collated by the network monitoring tools using standard protocols is displayed graphically to help admins use the information in managing a network in a streamlined way.
Network monitoring is a critical IT process that tracks network components and endpoints and provides fault, performance, and traffic monitoring. It involves monitoring critical network issues, providing fault detection, and health monitoring of various network elements from the device level to the protocol and interface levels.
A network monitoring application collects and reports on a variety of data from a computer network, including routers, switches, firewalls, load balancers and endpoints, like servers and workstations. The collected data is filtered and analyzed to identify a variety of network problems. These network problems can include the following:
- Device failures
- Link outages
- Interface errors
- Packet loss
- Application response time
- Configuration changes
blësk is a complete network monitoring solution to monitor a-z of a network.
It comes with the following 8 modules:
- Application Performance Monitor (APM)
- Network Performance Monitor (NPM)
- Network Traffic Analyzer (NTA)
- Event Log Manager (ELM)
- Switch Port Manager (SPM)
- Network Security Monitor (NSM)
- Network Configuration Manager (NCM)
- Asset Life Cycle Manager (ALCM)
Some of the key features are discussed below.
Application Performance Monitor (APM)
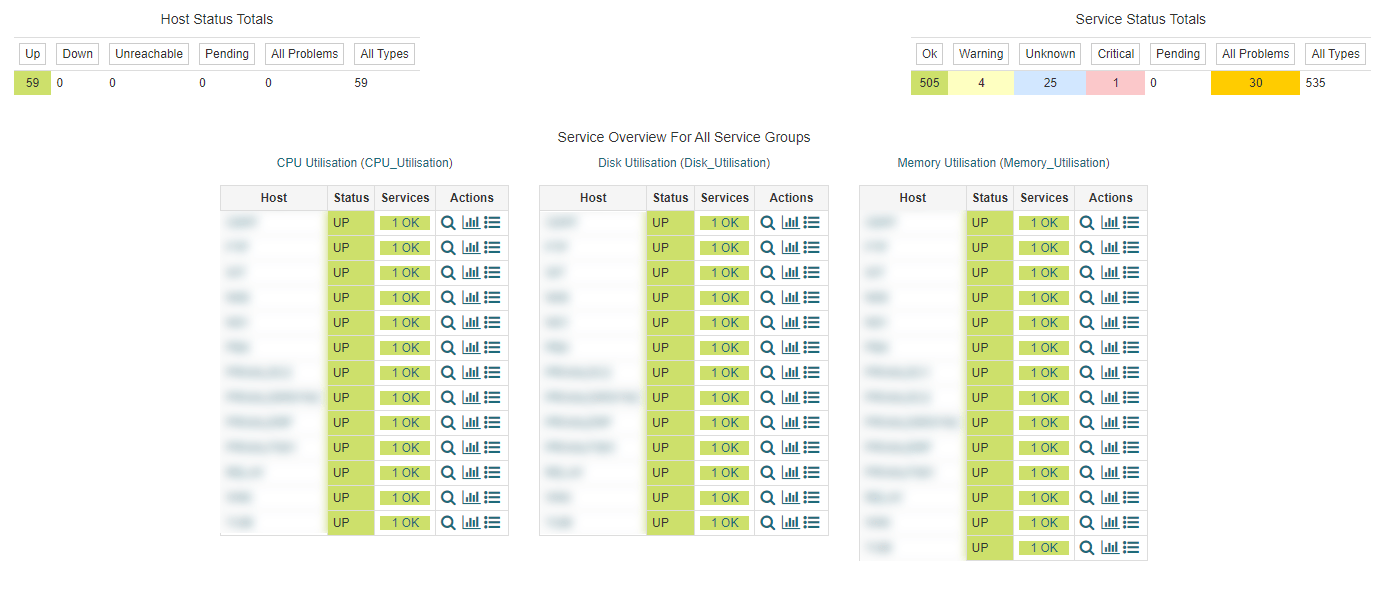
This module allows to view the status of all the service groups from the service group menu, which helps to identify is there is any Warnings or Critical errors exist among the services.
Application Performance Monitor (APM) module of blësk OS raises alert in the event of any interruption within the network. An alert is also sent by e-mail to the specified administrator(s) to notify about the issue. This all-in-one dashboard represents a single point of access for trend statistics and alert monitoring.

Network Traffic Analyzer (NTA)
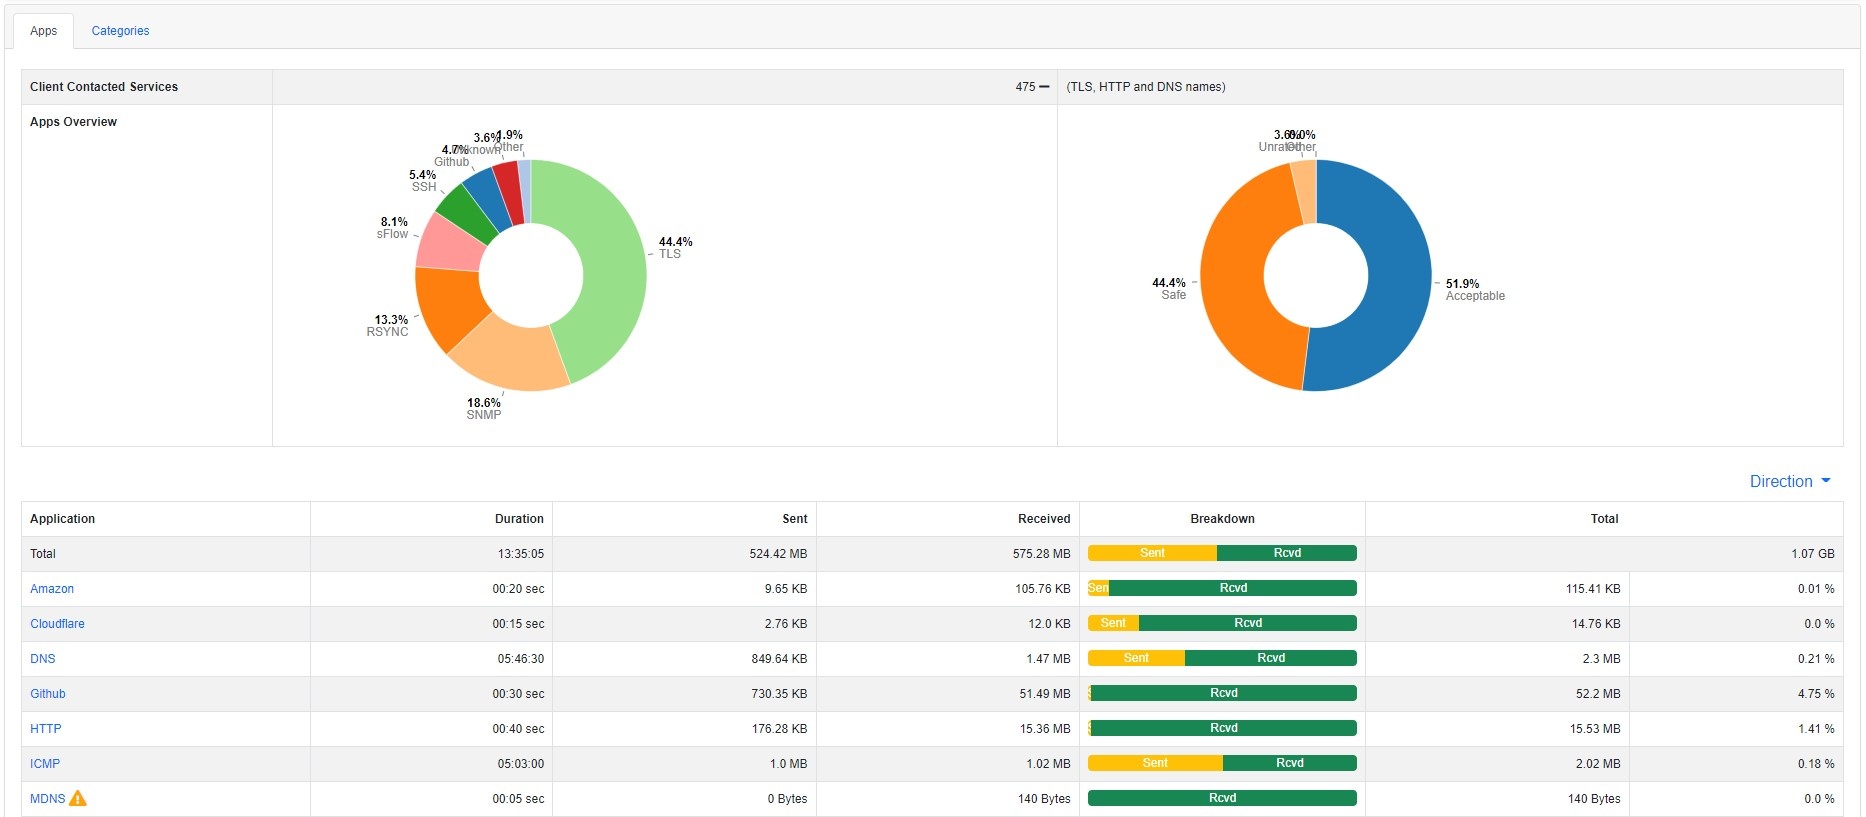
This module captures the continuous flow of network traffic and presents the data in graphs and tables. These can provide valuable information on how your network is being used. It is a simple, portable traffic measurement and monitoring tool, which supports various management activities, including network optimization & planning, and detection of network security violations.
blësk NTA helps the network administrators keep a close eye on network perimeter. Even with strong firewalls in place, mistakes can happen, and unwanted traffic could get through. Users could also leverage methods such as tunneling, external anonymizers, and VPNs to get around firewall rules.
NTA provides the ability to identify those situations where network traffic does not comply with specified policies, or when it exceeds defined thresholds. This will help you in detecting network configuration problems including:
Misconfiguration of software applications (by analyzing protocol traffic data)
Identification of hosts that use unnecessary protocols.
Excessive network bandwidth utilization
blësk NTA provides detailed information about network traffic, including traffic volume, key speakers, bandwidth consumption, and high usage times. It can use flow data statistics generated by routers, switches, specialized standalone hardware probes.
Briefly blësk NTA helps to is an essential way to monitor network availability and activity to identify anomalies, maximize performance, and keep an eye out for attacks.

Network Security Monitor (NSM)
blësk Network Security Monitor (NSM) function provides a way to continually identify potential vulnerabilities on systems and produces a detailed plan on how to remediate and remove those vulnerabilities from your critical business systems.
blësk NSM function allows to automatically scan a subnet of a network as per custom schedule and automatically report the results to the administrator by email in different format. blësk NSM module allows to define targets for vulnerability scan, which may be a single IP or range of IP addresses to execute NVT script towards targeted system(s) to test for vulnerability and it allows to schedule the frequency of running the test. NSM module allows to create infinite custom dashboard for group of devices for the ease of monitoring devices by device type.

Asset Life Cycle Manager (ALM)
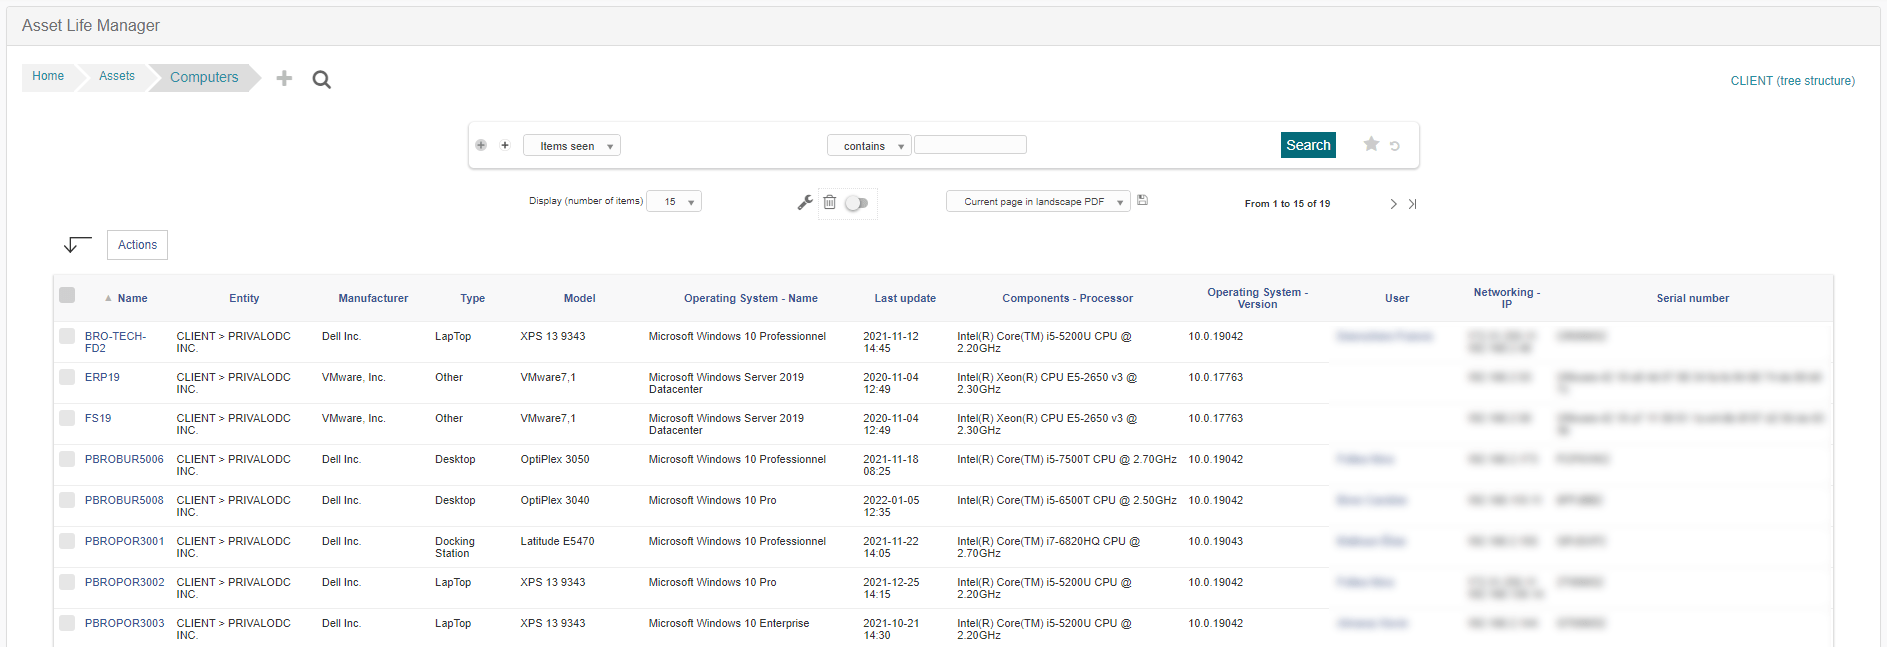
blësk Asset Life Cycle Manager (ALCM) module, allows to keep track of all the hardware, OS, software and even consumables. ALCM lists all the software in use, their version, date of installation, validity, the number of licenses available and much more.
The user-friendly dashboard allows administrators to perform the following tasks from the ALCM interface:
- Manage inventory of all the hardware and virtual assets
- Keep track of the software in use, version, quantity and the anticipation of software updates
- Complete history for each asset modification
- Associate support tickets with equipment or software

Switch Port Manager (SPM)
blësk Switch Port Manager (SPM) feature allow at-a-glance management of all switched access interfaces in the network. It allows IT administrators routinely review port utilization and capacity requirements. blësk SPM can be used to locate the switch port of an end-user system by IP or MAC address. Network switch port mapper tool helps network engineers identify the switch port to which a device is connected and thus eliminates the need of manually tracing the network cables. The switch port mapping tool discovers the devices plugged into each port of a specified switch.
In summary, network performance is key to streamlined operations of businesses of all kinds. Service interruptions can only be mitigated by real-time status update of network services.
We understand that some organization may don’t have inhouse capacity to facilitate many essential tasks; therefore, blësk offers managed services to the low resourced companies to monitor their network services.
Download a free trial of blësk or contact us for more information.


